Pump system efficiency is interlocked along with other system components within HVAC systems. Evidenced by movements in ASHRAE Standard 90.1,1 system efficiency has moved to the forefront when designing HVAC systems. As part of this movement, the design of end suction centrifugal pump products has advanced to enable improved system efficiencies. This design approach yields significant benefits to the designers and operators of HVAC systems for buildings and facilities. Primary among these enhancements are improved efficiency ranges offered by the newest designs. These efficiency improvements are best described as enhanced Efficiency Islands. This paper describes the Efficiency Islands and how, from a system perspective, these enhancements can address new system efficiencies or lead to the retrofit and improvement of existing systems.
EFFICIENCY ISLANDS
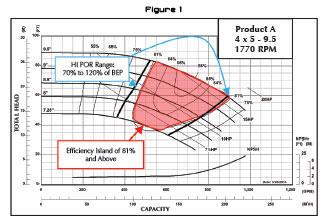
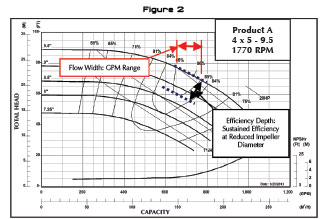
Let’s begin by describing what is meant by the term Efficiency Island. Figure 1 shows the Island (shaded red) with boundaries of the maximum impeller diameter performance, the minimum diameter performance and the iso-efficiency lines (81 percent and above in the illustration). This envelope looks like and is thus called an Efficiency Island. As seen in figure 1, there are many Efficiency Islands which make up the performance curve for a centrifugal pump. For the best operating performance, it is desired to have these Islands be as wide and as deep as possible. Figure 2 demonstrates what is meant by width (in terms of flow rate) and depth (in reduced impeller diameter) of these Islands. Figure 1 also shows the ANSI/Hydraulic Institute Standards2 Preferred Operating Range (POR) which is defined as the flow range from 70 to 120 percent of BEP. This is the optimal range for centrifugal pump operation.
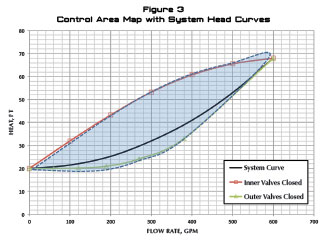
HVAC systems have substantial load variations (flow rates) depending on the load profile. Coupled with the load variations are the head variations, which are dependent on the physical size of the system and components within the system. One system head curve does not represent the true system resistance against which the pump must operate. Previous work has identified both lower and upper system head curves as applicable in heating and cooling systems.3,4 An example of the upper and lower system head curves and the control area is shown in figure 3. The area between the upper and lower system head curves is known as the control area (blue region). Pump operation can occur within this zone, not just at the upper and lower boundaries or on a single system curve within the boundary.
As figure 3 illustrates, operation in a narrow band of flow and pressure requirements simply doesn’t happen in the majority of these systems. So to provide efficient systems the Efficiency Islands need to be wide, deep and with high efficiency levels. Narrow flow width for iso-efficiencies and rapid drop in efficiency as the impeller diameter is reduced, are not desirable to achieve the most efficient system operation.
When considering operation with a constant speed drive to meet the variations of a typical load profile, one can readily see that control valve throttling moves the pump on its curve and dissipates significant energy – wasted energy and added operational cost. To handle normal load profiles, a variable speed drive is preferred to enable load variations to be achieved with overall improved system efficiency. Newer designs employing enhanced Efficiency Islands enable the engineer or operator to improve the system efficiency using either fixed or variable speed pump operation.
MODERN HVAC CENTRIFUGAL PUMP DESIGN OBJECTIVES
Modern designs should utilize the most sophisticated and cutting edge computational fluid dynamics design tools available to achieve improvement of efficiency in three aspects:
- Higher efficiency levels
- Wider efficiency ranges (from a flow rate perspective) at constant diameters
- Sustain higher efficiency levels as impeller diameters are reduced.
COMPARATIVE RESULTS
To examine how a modern HVAC centrifugal pump design improves efficient operation, flow and efficiency can be viewed from a slightly different perspective; that of efficiency versus flow rate as a percentage of BEP with particular emphasis on the Hydraulic Institute Preferred Operating Range.
The following illustrations will compare the results of a modern design effort to several current end suction products in the HVAC market. The majority of the new product sizes follow this example. The illustrations compare Product A (4 x 5 – 9.5) performance to Product B (4 x 5 – 9.5) and Product C (4 x 5 – 9.25) at 4 pole 60 Hz speed (1800 RPM). More conventional efficiency comparisons are also provided, as well as operating cost analyses for several heating load profiles and design conditions.
MAXIMUM DIAMETER EFFICIENCY COMPARISONS
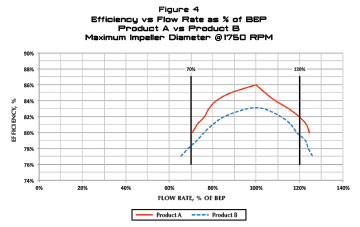
This comparison of maximum diameter efficiencies is done using a percentage of BEP flow. The Hydraulic Institute (HI) recommends a Preferred Operating Range (designated POR) as 70 to 120 percent of BEP flow rate. This ensures a consistent comparison is made among pumps with somewhat differing BEP flow rates. A comparison of the actual HI POR flow rates for each competitor at maximum and reduced diameter is also provided. Figure 4 illustrates the efficiency advantage for Product A in the HI POR band compared to Product B. At the same percentage of BEP flow, Product A has higher efficiency. At the same efficiency level, Product A offers a wider flow rate range.
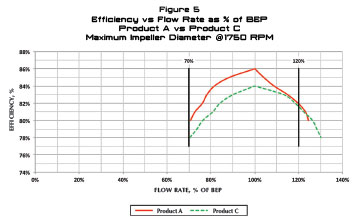
Figure 5 compares the maximum diameter efficiency of Products A and C. At the same efficiency, the range of BEP flow is greater for Product A than Product C. For example, the flow range of Product C at 83 percent efficiency is from 90 percent of BEP to 113 percent of BEP. The flow range for Product A at 83 percent is from 78 to 115 percent of BEP.
A LOOK AHEAD
Xylem has redesigned the complete line of its best-in-class Bell & Gossett® 1510 pump—now called the Series e-1510 brand—and the single stage end suction centrifugal pumps launched at the 2014 Air-Conditioning, Heating, Refrigerating Exposition (AHR Expo).
In part 2 of this series, we’ll compare efficiency at maximum and reduced diameter impellers while also examining the traditional view of flow versus TDH. The enhanced Efficiency Islands that result from these tests further illustrate the advantages found with the power of “e.”
NOTES
ASHRAE 90.1 – 2010 Energy Standard for Buildings
ANSI/Hydraulic Institute Standard 9.6.3 – 2012, Guideline for Allowable Operating Region
Simplified Analysis of Flow in Closed Loop Hydronic Systems, Bell & Gossett Technical Brochure TEH-802P, August 2001
Variable Primary Flow Systems, Bell & Gossett Technical Brochure TEH-910, 2010
_______________________________________________________________________
ABOUT THE AUTHOR
Christopher S. Johnson is the global engineering manager for centrifugal pumps in Xylem Applied Water Systems in the commercial building and HVAC business unit, while also supporting the other business units with crossover products. He has held leadership roles in sales, application engineering, product management, global sourcing, global product development, and engineering.
_______________________________________________________________________
MODERN PUMPING TODAY, January 2014
Did you enjoy this article?
Subscribe to the FREE Digital Edition of Modern Pumping Today Magazine!