


By the year 2000, failing septic systems were damaging the ecology of Keuka Lake in Jerusalem, New York. They were replaced with a low-pressure sewer system (LPS) that consisted of 265 grinder pumps. Part 1 provided an overview of the project while Part 2 began a ten-year analysis of it with an examination of operation and maintenance (O&M) data. Part 3 probes the project’s 2003 through 2013 hydraulic performance comparing expected design flows to quantitatively measured flows.
HYDRAULIC DESIGN AND PERFORMANCE
The installation and start-up of LPS systems often occurs over a time period of several months. When LPS is used with new home construction projects, complete build-out of a system may take several years. This often leads designers to wonder how a system will function hydraulically while fewer than anticipated homes are connected to the piping network.
Prior to achieving design capacity, fewer connected homes generate less wastewater flow rates with lower pipeline velocities. Lower pipeline velocities may allow particulate in the wastewater to drop out of suspension and begin to accumulate on the walls of the pipe thereby increasing the possibility for clogging.
In the case of the Town of Jerusalem, the study found the system operates at less than 50 percent of expected design flows with no adverse effect on system pipelines or equipment performance.
The first homes connected to the system are located on the far right side. The discharge point of the LPS that leads to the treatment plant in Penn Yan is on the left side. Following the pressure main from right to left, additional homes are connected and the pipe diameter increases accordingly.
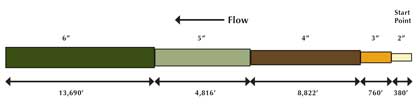
Figure 3: Simplified sketch of the LPS pressure main installed in the Town of Jerusalem.
PREDICTED PERFORMANCE
A hydraulic system design analysis was performed using construction drawings supplied by Clough, Harbour and Associates, LLP (CHA) and E/One’s Design Assistant software program. The results are summarized below.
The analysis reveals a system with key design parameters within industry recognized ranges.
- Anticipated water flow per home = 150 gallons (567.81 liters) per day.
- Maximum Total Dynamic Head (TDH) = 128 feet (39.01 meters), which complies with
- E/One’s rating of its 2000 Series grinder pump of 138 feet (42.06 meters).
- Maximum pipeline flow rate (at discharge point) = 39,300 gallons (148,767 liters) per day.
- Maximum pipeline velocity = 2.2-fps in most branches (2-fps is the industry standard).
- Retention time = 30 to 40 hours (this exceeds typical target of 10 to 12 hours). The project team recognized this and included the bioxide odor control system.
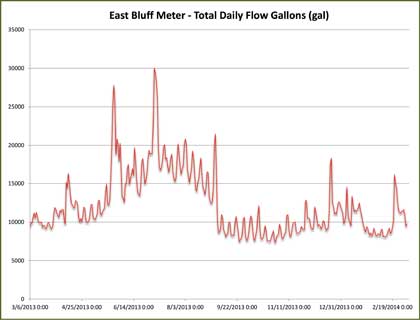
Figure 4: Plot of flow in gallons per minute in the 6-inch (152.4 millimeters) pipe measured just prior to the discharge point per 24-hour time period.
MEASURED PERFORMANCE
A flow meter was attached to the pressure main prior to the discharge point as shown in Figure 3. Measurements were recorded over the period of March 2013 through February 2014. Flow rates vary widely throughout the year as shown in figures 4, 5 and 6 due to the seasonal occupancy of the homes in the system. Observations include winter flow rates typically range from 7000 to 9000 gallons (26,497.88 to 34,068.71 liters) per day while summer (May to August) flow rates typically range from 20,000 to 30,000 gallons (75,708.23 to 113,562.35 liters) per day.
The data in figure 5 shows a spike in flow rate during the Fourth of July weekend period of 2013. We observed that the highest flow rate occurs during the summer and typically ranges from 30 to 40 gallons (113.56 to 151.42 liters) per minute.
Figure 6 shows a low flow rate during the late October through early November period of 2013. We observed that the lowest flow rate occurs during the winter and typically ranges from 7 to 9 gallons (26.5 to 34.07 liters) per minute.
The data from figures 5 and 6 can be used to calculate the actual velocity of the wastewater at the location of the flow meter in the pipeline during the summer peak and winter lull. This is essentially the velocity of the wastewater at the discharge point of the LPS system.
V = 0.4085 q / d2
Where:
V = velocity in feet per second (fps)
q = volume flow in gallons per minute (gpm)
d = inside diameter of the 6-inch pipe in inches (inches)
Summer velocity = 0.71-fps = 0.4085 (50) / (5.349)2
Winter velocity = 0.19-fps = 0.4085 (9) / (5.349)2
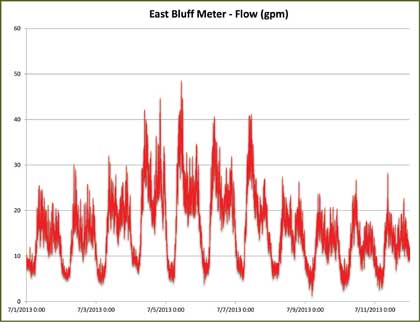
Figure 5: Plot of “summer” flow in gallons per minute in the 6-inch (152.4 millimeters)
pipe measured just prior to the discharge point.
PERFORMANCE COMPARISON
The measured pipeline velocities in the system at the discharge point are significantly lower than the predicted velocities. Even peak summer velocities are less than half of the target velocity of two-fps. These variations are most likely because of the following:
- Lower than anticipated water usage by homeowners: An estimate of 150 gallons (567.81 liters) per day was used to calculate the predicted performance. Daily water usage is probably lower due to the seasonal nature of the homes.
- Lower occupancy even during summer peak periods: Many of the homes in the system are summer or second homes.
- The location of the measuring point: Measurements were taken in the 6-inch (152.4 millimeters) diameter pipe at the very end of the low-pressure sewer system. It is very likely that many locations within the system reach much higher velocities.
It is very common for an LPS to operate at lower than anticipated pipeline velocities. In fact, almost all systems serving new home construction operate at lower than expected flows during the build out period. Figures 7 and 8 below are of sections of pipe removed from two such projects that served as LPS validation tests by E/One many years ago.
When this system was installed in 1972, initially only one home was connected resulting in a pipeline velocity of only 0.26-fps. This section of pipe was removed sixteen months later when forty-one homes were connected. The pipeline velocity at that point is calculated to be 1.87-fps.
Figure 7 from Golfview, Indiana, is a picture of a section of 4-inch (101.6 millimeters) diameter SDR 26 PVC pipe that was removed from the system.
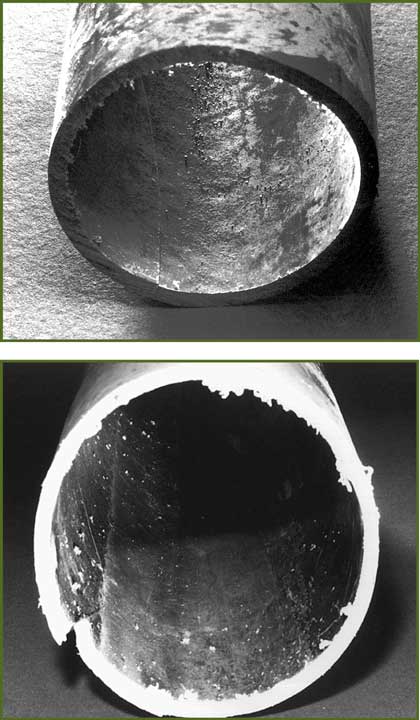
Figure 8 from Grandview Lake, Indiana, is a picture of a section of 3-inch (76.2 millimeters) diameter SCH 40 PVC pipe that was removed from the piping network.
Initially only nine pumps were connected yielding a calculated velocity of 1.72-fps. The system operated under these conditions for more than two years. Eventually additional homes were added and the predicted velocity of two-fps was reached.
This data demonstrates the flexibility of LPS systems that utilize positive displacement pumps with near vertical H – Q pump curves. If debris does begin to build up on the inner walls of the system piping, the effective diameter of the pipe is reduced. The flow rate from the progressing cavity pump is essentially unaffected due to the vertical nature of its curve.
The velocity equation below shows that if the flow rate remains constant and the pipe diameter is reduced, the velocity will increase. This increase in velocity creates a self-scouring effect on the pipeline.
V = 0.4085 q / d2
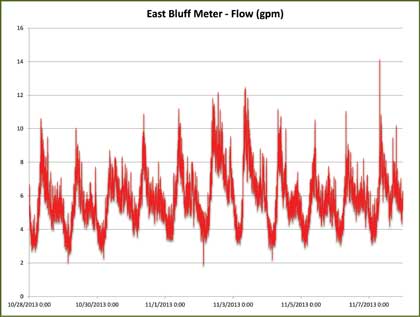
Figure 6: Plot of “winter” flow in gallons per minute in the 6-inch (152.4 millimeters)
pipe measured just prior to the discharge point.
CONCLUSIONS
The transition from decentralized, independent septic systems to a centralized LPS is viewed as a tremendous success by a wide variety of stakeholders. The quality of the lake water improved significantly.
Homeowners are now allowed to improve their properties by winterizing their homes, building additions and in some cases constructing entirely new structures.
The financial agreement for sewage treatment between Jerusalem and Penn Yan was based on anticipated design flows. The actual measured flows shown in figures 4, 5, and 6 reveal on average the system discharges much less wastewater into the treatment facility than was anticipated.
Based on this information, the town is planning a much larger follow-on LPS project to convert additional homes presently using septic systems to LPS.
Three key conclusions regarding this LPS system are evident from the data. The system is:
- Reliable and Cost Effective: Mean time between service calls was calculated to be 28 years. The O&M costs were found to be approximately $37/year/home. Construction costs for a low-pressure sewer system were determined to be 50 percent lower than construction costs for a conventional gravity system.
- Hydraulically Flexible: Wastewater velocities at the discharge point are as low as 0.19-fps in the winter and reach a peak of only 0.71-fps during peak occupancy summer months. Despite these lower than expected velocities, there is no evidence of debris accumulation. The system does not require manual flushing or any other preventive maintenance to prevent clogging.
- Quality of Life Improved: The transition from septic systems to LPS allowed homeowners to free their minds from the constant worry of septic system maintenance and failure; once again obtain building permits to improve their homes and property values which had been halted due to poor lake water quality measurements; and, feel good about “thinking globally and acting locally” to improve the water quality of their glacier-carved lake. ■
REFERENCES
- Goncz, Daniel J., “Pressure Sewer System Design, Construction and Operation History at Lake Latonka, Mercer County, Pennsylvania, June 2010.
- Albro, Henry S., “Ownership of Pressure Sewer Systems”, with key contributions from the towns of Chelmsford and Marion, MA.
- EPA – R2-72-091 November 1972 “A Pressure Sewer Sytem Demonstration.”
- Wastewater Collection System Modeling and Design, First Edition, Haestad, Walski, Barnard, Harold, Merritt, Walker & Whitman, 2004.
- Water Environment Federation (WEF) “Alternative Sewer Systems, Second Edition, Manual of Practice FD-12, 2008.
- Submersible Sewage Pumping Systems (SWPA) Handbook, Fourth Edition, SWPA 2012.
About the Author
Wayne Ackart, P.E. is town engineer for the Town of Jerusalem. Clark A. Henry is director of engineering at Environment One. He can be reached at chenry@eone.com. Michael Crowley is LPS system designer at Environment One. For more information on Environment One Corporation’s full line of grinder pumps and LPS solutions, visit www.eone.com or call 518.346.6161.
MODERN PUMPING TODAY, November 2014
Did you enjoy this article?
Subscribe to the FREE Digital Edition of Modern Pumping Today Magazine!