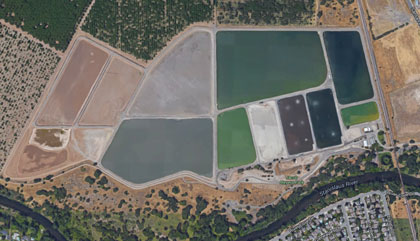
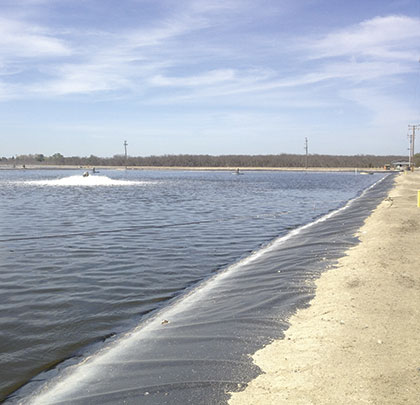
In last month’s introduction to this article, the City of Riverbank, California, hired Schneider Electric to evaluate its wastewater treatment plant for energy savings opportunities. Faced with competing pressures to cut costs, modernize, and meet growing regulatory requirements, Riverbank was like many other cities who struggle to make the necessary improvements in a time of budget restraints.
FIVE PHASES OF ENERGY ANALYSIS
In order to determine the energy and utility savings that would be seen from this project, a five-step process was used including:
Benchmarking
The first step in the analysis was to benchmark the wastewater treatment plant’s energy use to identify the magnitude of energy savings available. Monthly utility bills from August 2010 through September 2012 were collected to determine the annual energy consumption of the plant. Monthly operating reports were also collected, which showed the plant’s daily flows and loadings. This data was then compared with industry benchmarks to identify potential savings opportunity. Based on these comparisons, it was apparent that the wastewater treatment plant at the City of Riverbank was using more energy than needed. In fact, the opportunity to save 50 percent or more in energy was anticipated based on analysis.
Baseline Utility Analysis
The next step was to create a utility baseline. The two years of energy and demand usage from the monthly billing data were compared year to year to identify any anomalies or changes in operation. In addition, fifteen-minute interval data was collected for the electric meter for the most recent twelve months. This data was analyzed and found to be very consistent between the days in a given week or month, with the exception of when maintenance activities occurred. Schneider Electric also evaluated the utility rate, using a tariff simulation to verify that the rate structure was understood.
Baseline Energy Analysis
Then, Schneider Electric created an energy baseline of the plant to ensure operations were understood. Operational information was collected through interviews with plant operators as well as analysis of utility data, which showed that plant energy usage decreased from the first year to the second year.
The interval data was very helpful as it also provided insight into the operation of the plant and how the loads were being controlled. The plant operated at a near constant load throughout the day with an approximate 110 kW increase in load between 2 a.m. and 8 a.m. Upon further analysis, the base load corresponded to seven of the surface aerators operating at a time, while the increased load corresponded to nine of the surface aerators operating. It was also noticed in the interval data, that only eight of the surface aerators were typically running between 2 a.m. and 8 a.m. on Sundays. Additional deviations from the base load were noted in other days, which corresponded to when transfer pumps were being used to transfer the effluent from the treatment ponds to the percolation ponds or when maintenance activities took place.
Once the operation of the plant was understood, a baseline energy model was created that estimated a twenty-four-hour profile of electric demand of the surface aerators, transfer pumps, headwork motors, and miscellaneous loads. The resultant loads were summed up and compared with the utility baseline.
Post-Retrofit Energy Analysis
Next came an estimate of the energy usage of the wastewater plant once the proposed retrofit took place. Savings came from two primary sources. First, since the fine bubble diffusers had much higher oxygen transfer efficiency than the surface aerators, the horsepower requirements for the blower motors were greatly reduced from those of the surface aerators. Second, since the VFD speed on the blower motors would be controlled to a dissolved oxygen set point in the treatment ponds, the power draw on the motors could be even further reduced from the peak for which they were designed.
Savings were determined using two approaches. The first approach was to calculate the energy (kWh) savings. The hourly profile for the wastewater treatment plant from the model was binned into the three time-of-use periods for each month. The difference between the baseline energy use and the post-retrofit model use was then calculated using the minimum method to determine the energy savings, ensuring savings are not overestimated for any of the data points. The energy savings for this project were estimated to be 2,593,087 kWh per year, or 74.98 percent of the baseline.
The second approach was to calculate the demand (kW) savings. Because demand is easily impacted by small variations in flow rates, it is difficult to accurately project the savings that will actually be seen on utility bills from the demand component. For this reason, a conservative approach was used to determine the expected demand savings. The demand savings for this project were estimated to range between 268 kW and 326 kW, depending on the month. This is equivalent to 41.75 percent of the baseline demand values.
Post-Retrofit Utility Analysis
The final step in the analysis was to determine the financial value of the energy and demand savings from this retrofit. The savings values calculated previously were run through the tariff simulation to determine the expected utility bill after the retrofit takes place. The difference between the baseline cost and this calculated cost are the anticipated savings. The dollar savings for this project were estimated to be $240,129 per year, or 65.4 percent of the baseline costs.
A financial analysis for this project was done to show how quickly this retrofit would pay for itself in utility bill savings. The city wanted to have a project that would pay for itself within the life of the equipment being installed–an average of fifteen to twenty years. The final project cost for this retrofit was $3.9 million, which gave a simple payback of 16.5 years.
The procurement method used by the city to complete this work was an energy savings performance contract (ESPC). In an ESPC, the customer will typically take out a loan to pay for the project. They will contract with an energy services company (ESCO), who will be paid for the implementation of the work, and in turn will guarantee the customer that they will see the savings that were estimated on their utility bills. If those savings are not achieved, the ESCO will be liable to write the customer a check for the difference.
Riverbank chose this procurement methodology because they did not have the upfront funds to pay for the plant upgrade. Additionally, they wanted the fixed price contract that comes with an ESPC and the guarantee of utility savings so they could be sure to have the funds available to pay off the loan.

CONCLUSION
The project with the City of Riverbank and Schneider Electric has proved to be a successful partnership where the city received an upgraded wastewater treatment plant which resulted in a significantly reduced electric utility bill. In order to support the financial analysis and guarantee associated with this project, a detailed and innovative approach to estimating energy savings was developed. While not every wastewater plant will have the same magnitude of opportunity as this one, it is a great example of how a city can mitigate risk, upgrade their plant, become more efficient and utilize utility savings to pay for it. ◆
For More Information:
Ben Johnson is energy engineering manager for Schneider Electric Energy and Sustainability Services. Schneider Electric offers integrated solutions across multiple market segments, including leadership positions in utilities and infrastructures, industries and machine manufacturers, non-residential buildings, data centers and networks, and the residential sector. For more information, visit www.enable.schneider-electric.com.
____________________________________________
MODERN PUMPING TODAY, July 2016
Did you enjoy this article?
Subscribe to the FREE Digital Edition of Modern Pumping Today Magazine!
![]()


