


In part 1 of this series focused on nine economic facts about water in the United States, we addressed three facts related to the severe drought conditions the United States is currently experiencing:
- The United States is experiencing serious, but not unprecedented, drought conditions.
- Many of America’s Western states are consistently vulnerable to drought.
- Population growth is highest in America’s driest states.
In this month’s installment, we’ll address the importance of water to the U.S. economy. A vast majority of the United States’ water withdrawals go to two sectors: irrigation and power generation. Water is also vital for companies in a variety of industries.
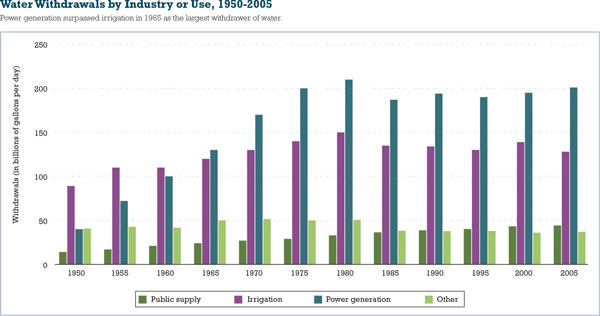 Figure 4: 2005 is the latest year for which data are available. “Other” includes self-supplied water for domestic, industrial, and livestock purposes, as well as for mining, commercial, and aquaculture purposes for the years in which these estimates were available. Sources: Kenny et al. 2009; authors’ calculations.
FACT 4: HALF OF WATER WITHDRAWALS IN THE UNITED STATES ARE USED FOR POWER GENERATION
Roughly 80 percent of the nation’s water withdrawals go to power generation and irrigation. Not all of this water is consumed or used up, however. Water scientists distinguish between water withdrawals (water diverted from a source, such as an aquifer, river, or ocean) and water consumption (water that evaporates, is incorporated into crops, is used as drinking water, or is otherwise removed from the source). Withdrawn water can be either fresh or saline, although the latter is typically employed for power generation.
In 2005, the latest year for which data are available, approximately 49 percent of total water withdrawals were used to generate power, and another 31 percent were used for irrigation. Power generation—more specifically, the generation of electricity in power plants—often requires water to operate steam-driven turbines, and water is also important for cooling in power plants (especially nuclear ones). Irrigation includes water applied to assist crop and pasture growth as well as to maintain vegetation on recreational lands such as parks and golf courses. The share of withdrawn water that is consumed—not returned to its source—is higher for agriculture than it is for power generation, so even though withdrawals are greater for power generation, consumption is not.
Only 11 percent of total water withdrawals went to public-supply water uses in 2005. The other 9 percent of total withdrawals were primarily self-supplied, used for domestic, livestock, and mining purposes, among others.
As shown in figure 4, power generation became the largest withdrawer of water in 1965 as the amount of energy generated nationwide increased. Since the mid-1970s, however, water withdrawals for power generation have stabilized even as population and the economy have grown. This stabilization is due in part to limited water availability in some areas as well as to laws such as the Clean Water Act that regulate cooling systems and mandate use of best available technology. Power plants have increasingly built cooling systems that recirculate water, as opposed to using water and then returning it to its source. Thus, although power generation withdraws more water than irrigation, much of this water is recirculated; the ratio of total water withdrawals to energy produced declined significantly between 1950 and 2005, from 63 to 23 gallons per kilowatt hour.
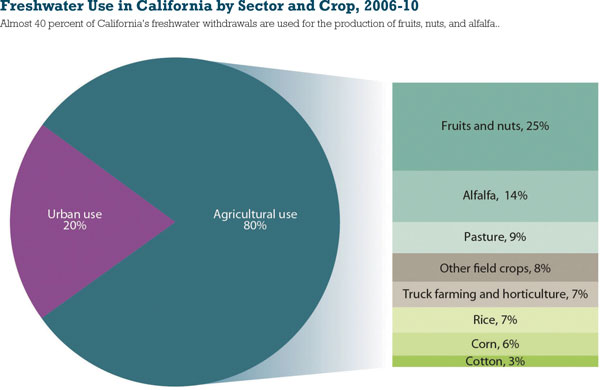
Figure 5: The figure shows the average applied water use for 2006–10. Water use in this figure excludes saline water and water dedicated to environmental flows. “Urban use” refers to use by households and nonfarm businesses. “Agricultural use” refers to water used for crop production. Estimates may not add up to 100 percent due to rounding. Sources: Hanak, Mount, and Chappelle 2014; authors’ calculations.
FACT 5: EIGHTY PERCENT OF CALIFORNIA’S FRESHWATER WITHDRAWALS GO TO AGRICULTURE
Agriculture requires large amounts of water. As our country’s leading producer of food, California withdraws most of its freshwater for agricultural purposes. Approximately 80 percent of California’s freshwater goes to agricultural uses, as seen in figure 5, with the remaining 20 percent going to urban uses for households and nonfarm businesses. The production of fruits and nuts alone uses almost one quarter of California’s freshwater, and alfalfa production uses more than one eighth of the state’s freshwater.
California’s agriculture is critical to our national economy. Over one third of the country’s vegetables and nearly two thirds of the country’s fruits and nuts were produced in California in 2012. California is also the near-exclusive supplier of certain crops in the United States. For instance, between 94 percent and 99 percent of our country’s shelled almonds, olives, broccoli, and celery were produced in California in 2012. California is also the country’s largest agricultural exporter: in 2012 the state’s agricultural exports generated more than $18 billion, 13 percent of the nation’s total; among fruits, nuts, and vegetables, the exports of California alone accounted for almost three fifths of the U.S. total.
The share of water that California uses for agriculture peaked in 1980 and has gradually declined since then. However, the value of agricultural output has continued to increase as farmers have adopted more-efficient irrigation techniques and shifted toward crops that generate more value per volume of water used. However, these improvements are not universal; for example, as a result of economic incentives, many of California’s farmers continue to use tremendous amounts of water growing alfalfa during the summer when temperatures are high and both yields and quality are low. These agricultural patterns are due in part to restrictions on water trading, as well as to the relatively low water prices charged to farmers, as compared to prices charged to nonagricultural water users.
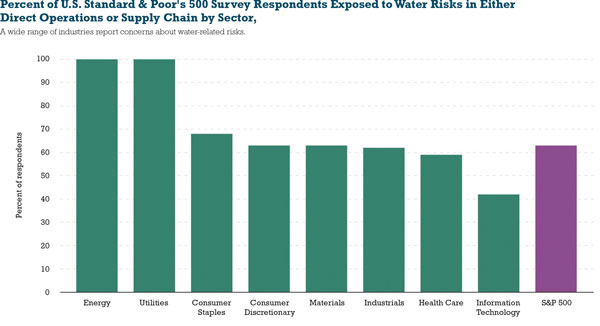
Figure 6: Survey responses are based on the water disclosures of 145 Standard & Poor’s 500 Index (S&P 500) companies—representing a 43 percent response rate—that participated in the Carbon Disclosure Project 2013 water disclosure survey. Water-related risks or impacts refer to a number of issues such as water stress or scarcity, flooding, high water prices, and regulatory uncertainty. Source: Carbon Disclosure Project and Deloitte Consulting, LLP 2013.
FACT 6: WATER IS A CRUCIAL INPUT FOR A WIDE VARIETY OF AMERICAN INDUSTRIES, NOT JUST AGRICULTURE
Companies in all sectors report that they are exposed to water risks such as water stress or scarcity, high water prices, and regulatory uncertainty. Respondents in a recent water stewardship survey represented different industries, including those with obvious ties to water such as energy and utilities, as well as those for which water connections are less immediately apparent, such as the consumer discretionary sector (e.g., Starbucks and Best Buy) and the consumer staples sector (e.g., Wal-Mart and Whole Foods). As shown in figure 6, in each of the eight sectors at least 40 percent of respondents reported exposure to water risks in their companies’ direct operations or in their supply chains.
Companies in a broad range of industries rely on water as a critical input. As an example, the technology industry heavily depends on water as a cooling mechanism because of its remarkable heat-absorbing capacity; in fact, many companies use water as a means to cool millions of computers that generate a considerable amount of heat. Similarly, water is essential for producing electricity and is thus indispensable to the energy industry. Water is necessary not only for producing power, but also for mining, refining, processing, and transporting oil, natural gas, coal, and other fuels, such as ethanol. Fracking, also, is highly dependent on large amounts of water to extract oil and gas.
As our country becomes increasingly high-tech and requires even more energy, companies will continue to need water. For this reason, many businesses have begun implementing concrete targets or goals—such as usage reduction, efficiency improvements, or regulation compliance—focused solely on water management within their direct operations.
A LOOK AHEAD
Both domestic water use and water prices vary across the United States. Moreover, our country’s systems for delivering water are highly fragmented. Next month, in the conclusion to this series, we’ll look at three facts representing barriers to efficient uses of water. ◆
For More Information:
This series was prepared for the Hamilton Project by Melissa S. Kearney, Benjamin H. Harris, Brad Hershbein, Elisa Jácome, and Gregory Nantz. The Hamilton Project seeks to advance America’s promise of opportunity, prosperity, and growth. For more information, and additional details on the Hamilton Project’s other policy briefs, visit www.hamiltonproject.org.
____________________________________________
MODERN PUMPING TODAY, March 2016
Did you enjoy this article?
Subscribe to the FREE Digital Edition of Modern Pumping Today Magazine!
![]()