

Before we conclude this series focused on nine economic facts about water in the United States, we should briefly review the first six facts (from Parts 1 and 2) addressing the realities of drought conditions in America and the importance of water to the U.S. economy:
The United States is experiencing serious, but not unprecedented, drought conditions.
Many of America’s Western states are consistently vulnerable to drought.
Population growth is highest in America’s driest states.
Half of water withdrawals in the United States are used for power generation.
Eighty percent of California’s freshwater withdrawals go to agriculture.
Water is a crucial input for a wide variety of American industries, not just agriculture.
Both domestic water use and water prices vary across the United States. Moreover, our country’s systems for delivering water are highly fragmented. In this month’s article, we will examine the use of water per capita in the driest states, the variability of household water prices, and the raw number of water systems in the United States.
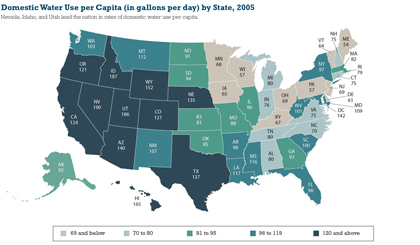
Figure 7: 2005 is the latest year for which data are available. The five categories were constructed to contain roughly the same number of states. Domestic water includes self-supplied withdrawals as well as public-supply water deliveries.
FACT 7: DOMESTIC USE OF WATER PER CAPITA IS HIGHEST IN THE DRIEST STATES
Domestic water use per capita—how much water each person uses at home—varies substantially across states. In particular, many of the states facing the most severe drought conditions also have the highest rates of domestic water use per capita.
There is considerable regional variation when it comes to total domestic water use, which includes indoor uses (e.g., drinking, flushing toilets, preparing food, showering, and washing clothes and dishes) as well as outdoor uses (e.g., watering lawns and gardens and washing cars). States with the largest populations predictably use the most water. However, as illustrated in figure 7, there is also wide regional variation in domestic water use per capita, ranging from 54 gallons per day in Maine to 190 gallons per day in Nevada, with Idaho (187 gallons) and Utah (186 gallons) right behind. Indeed, the highest rates of domestic water use per capita in the country are consistently found in the West.
Outdoor watering is the main factor driving the higher use of domestic water per capita in drier states in the West. Whereas residents in wetter states in the East can often rely on rainwater for their landscaping, the inhabitants of Western states must rely on sprinklers. As an example, Utah’s high rate of domestic water use per capita is driven by the fact that its lawns and gardens require more watering due to the state’s dry climate. Similarly, half of California’s residential water is used solely for outdoor purposes; coastal regions in that state use less water per capita than inland regions, largely because of less landscape watering.
It is worth noting, however, that per capita water use in California has declined in recent decades as a result of efforts to reduce water use through pricing incentives and mandatory installation of water-saving technologies, such as restricted-flow showerheads and low-flow toilets.
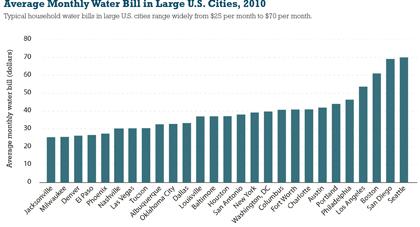
Figure 8: “Average monthly water bill” refers to the monthly water bill charged by the municipal water systems that operate in the selected cities assuming a monthly water use of 11,200 gallons.
FACT 8: HOUSEHOLD WATER PRICES VARY TREMENDOUSLY ACROSS CITIES
The price that households pay for water is highly variable across cities, even when controlling for the volume of water that different households use. Figure 8 shows average monthly water bills for households in large U.S. cities, assuming monthly consumption of 11,220 gallons, which is the typical usage for a family of four.
In Seattle, water costs $70 each month, or two and a half times the cost of water in Jacksonville or Milwaukee. Many cities in the West—such as Denver, El Paso, Phoenix, Las Vegas, Tucson, and Albuquerque, as shown in figure 8—have inexpensive water bills, but other dry cities, such as Los Angeles and San Diego, have among the highest water costs. Some of these differences are explained, in part, by provisions of the Clean Water Act that legally required certain older cities, including Boston and Seattle, to build new infrastructure—the costs of which are passed on to consumers through higher water bills.
Although many factors influence the price of household water, it is interesting to note that even cities in close proximity to one another may have considerably different water bills for the same volume of water. Philadelphia and Baltimore, for example, are less than one hundred miles apart, yet water systems in Philadelphia charge almost $10, or about 27 percent, more per month than water systems in Baltimore.
Many utilities also employ rate structures that change as water consumption changes. While some American cities (such as Nashville, Albuquerque, Oklahoma City, New York, Washington, DC, Portland, and Seattle) use uniform pricing structures, in which users are charged a constant rate for each gallon, many other cities (such as Phoenix, Dallas, and Los Angeles) employ increasing block rates that rise as consumption rises. Systems in some cities—such as Milwaukee, Baltimore, and Philadelphia— use decreasing block rates (where the cost of an additional gallon decreases as the total amount of water consumed increases), though this type of pricing structure is being phased out: from 1998 to 2010, the share of municipal systems using decreasing block rates fell from 35 percent to 19 percent.
FACT 9: THERE ARE MORE WATER SYSTEMS IN THE UNITED STATES THAN THERE ARE SCHOOLS
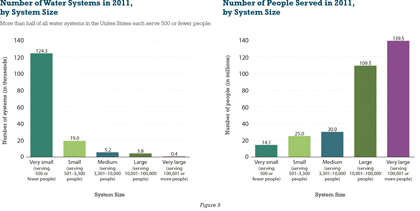
The United States has a complex network of water systems designed to meet a variety of objectives. In 2011 there were more than 152,000 water systems in service across the country. Indeed, our country has more water systems than it has elementary, middle, and high schools and post-secondary institutions combined. The severe fragmentation of the water sector not only poses a challenge to regulators, but also can inhibit the diffusion and take-up of new technologies.
Water systems vary by function. About two thirds of U.S. water systems are seasonal or do not serve the same population year-round, ranging from campgrounds and gas stations serving one hundred or fewer people, to the New York State Fair serving about 2 million Americans. The remaining 50,000 or so water systems, called Community Water Systems, are in service year-round and provide water to at least twenty-five people and often far more. The EPA estimated that Community Water Systems served almost 300 million people in 2011, or approximately 96 percent of the U.S. population.
Water systems vary greatly in terms of number of customers served. For example, roughly 250 million people are served by approximately the largest 4,200 Community Water Systems. An additional 50 million people are served by roughly 50,000 smaller Community Water Systems. (As mentioned above, the remaining 100,000 water systems are seasonal or serve transient populations.)
As illustrated in figure 9, the majority of water systems are very small, serving 500 or fewer people. Variation in system size presents challenges. For example, small and specialized water systems may lack the institutional capacity to raise the necessary funding for costly repairs, new equipment, and meeting EPA regulations. Small water systems would likely benefit from new technologies: in the latest EPA report, the smallest water systems (those serving 500 or fewer people) were responsible for approximately 74,000 water quality violations.
THE NEED FOR COOPERATION
Water is a vital resource for both quality of life and economic prosperity. It is critically important that public sector concerns at the municipal, state, and federal levels be addressed in the complete context of the United States’ agricultural, industrial, and power generation sectors’ demands on the U.S. water supply. The diversity and plurality of our country’s water system may at first seem a daunting obstacle to overcome, but from these varied experiences can also come the solutions for the pending drought crisis. ◆
For More Information:
This series was prepared for the Hamilton Project by Melissa S. Kearney, Benjamin H. Harris, Brad Hershbein, Elisa Jácome, and Gregory Nantz. The Hamilton Project seeks to advance America’s promise of opportunity, prosperity, and growth. For more information, and additional details on the Hamilton Project’s other policy briefs, visit www.hamiltonproject.org.
____________________________________________
MODERN PUMPING TODAY, April 2016
Did you enjoy this article?
Subscribe to the FREE Digital Edition of Modern Pumping Today Magazine!
![]()
In Times of Drought: Part 3 of 3
